Large and complicated data sets can be interpreted effectively via data visualization. It entails making graphical depictions that provide in-depth information and can be utilized to produce insights about a certain issue. It can be as straightforward as a graph or chart or as intricate as an interactive dashboard with numerous widgets and interactive components.
When data is presented visually, it might be easier to spot patterns and problems as well as connections and linkages that are not immediately obvious when looking at raw data alone.
In this article, I'll show you how to create a chart using the chart.js library within a React.js application.
prerequisite
Have a basic understanding of the React.js framework.
Install node.js on your system.
Install Chart.js library and react-chartjs-2.
Install Tailwindcss or any other CSS framework for styling your project.
What is Chart.js
Chart.js is a JavaScript toolkit used to build charts and graphs for web pages. It enables programmers to generate graphs like pie charts, bar charts, and line graphs.
The library, which is incredibly configurable and simple to use, draws the charts using the HTML5 canvas element. It also enables interactive elements and animation. Many developers use and support it widely.
Why Should You Use Chart.js for Your Project?
Responsiveness: Chart.js is responsive by design, and it will automatically change the chart's size to fit the available area.
Cross-browser compatibility: The majority of contemporary online browsers, including the most recent iterations of Chrome, Firefox, Safari, and Edge, are all compatible with Chart.js.
Animation: Adding some great animations to the chart with Chart.js also makes it more appealing and interactive.
Open-source: Being an open-source library, Chart.js is accessible for free and is simple to incorporate into any project.
Customization: A wide range of customization options are available with Chart.js, including various chart kinds, colors, and data labels.
Getting Started with Chart.js in React Project
React-chartjs-2 provides various chart types for selection, such as Bar, Pie, and Line charts. Its React components have attributes, that are passed in as props to what is rendered.
To integrate Chart.js in a React project, you'll need to install the chart.js and react-chartjs-2 packages, which provide a React-friendly wrapper for the Chart.js library. Here's an example of how you can get started:
npm install react-chartjs-2 chart.js --save
Creating a Bar chart using chart.js
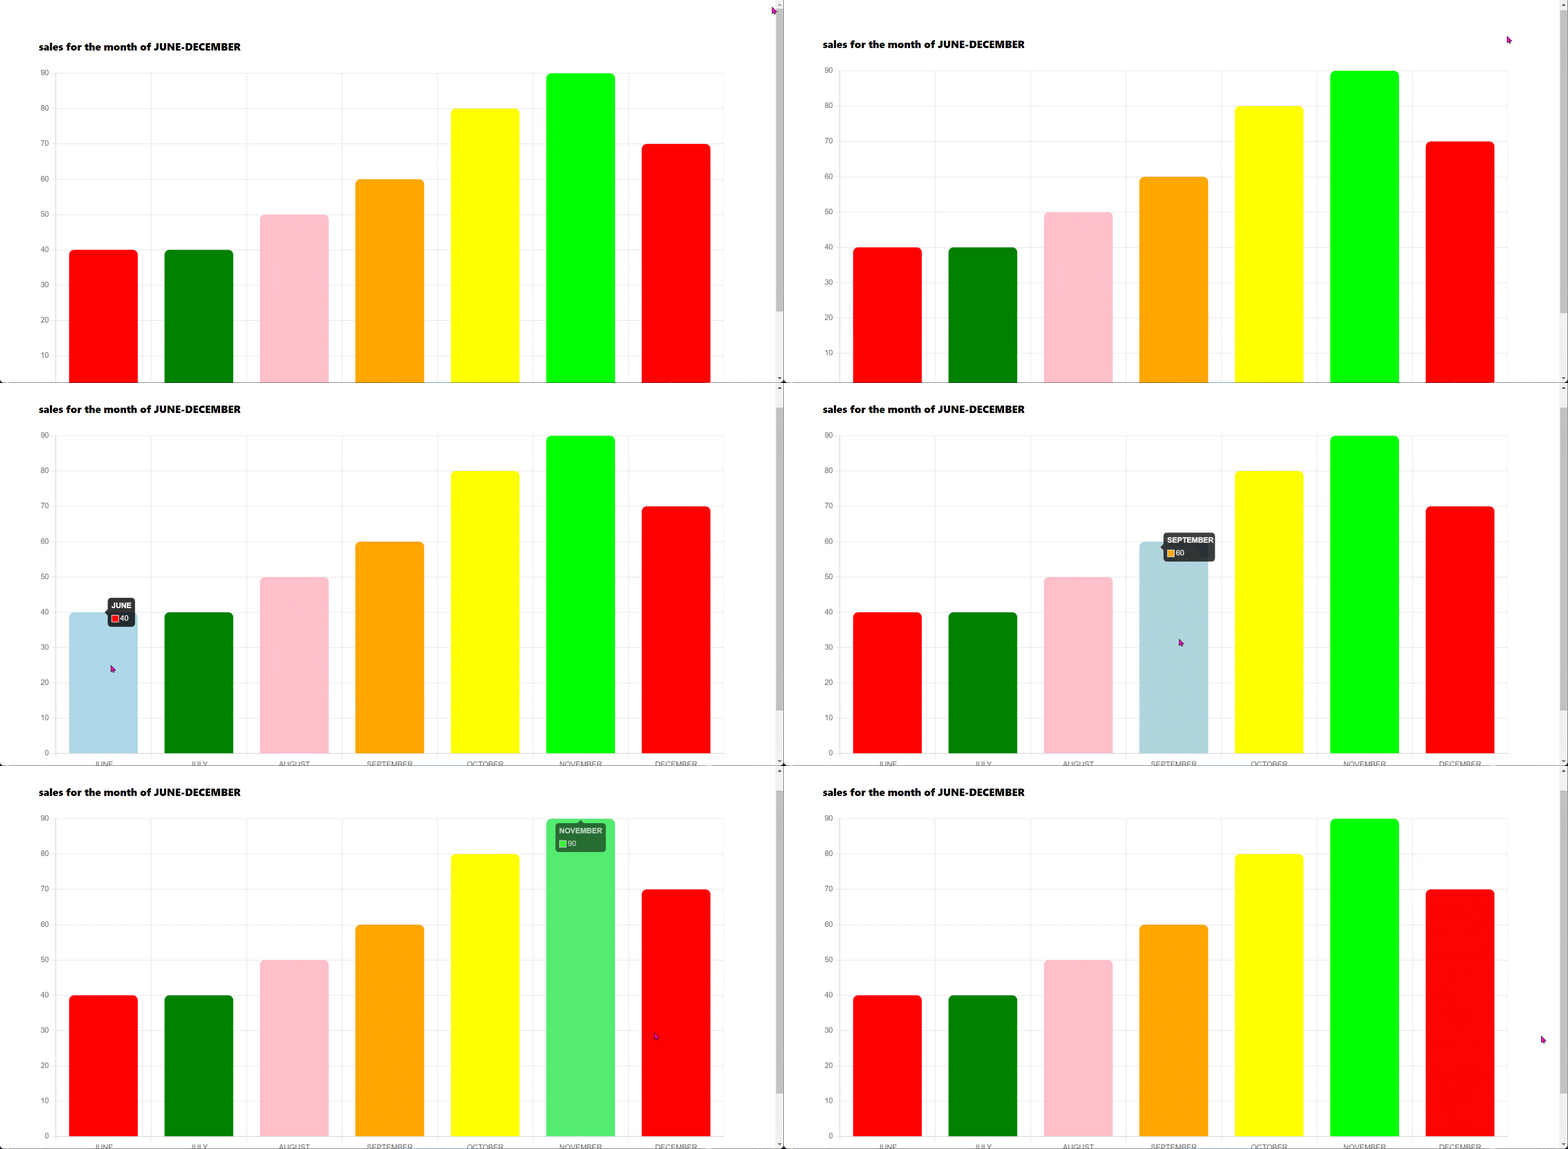
A bar chart is a graphical representation of data using rectangles, usually with heights or lengths proportional to the values they represent. They are commonly used to compare changes over time or differences between groups.
- Import
Barfrom thereact-chartjs-2library into your React component.
import { Bar } from 'react-chartjs-2'
- Next, Import labels from Chart.js
import {
    Chart as ChartJS,
    CategoryScale,
    LinearScale,
    Title,
    BarElement,
    Tooltip,
} from 'chart.js';
- Activate the labels by registering them such as tooltips. This will ensure that the labels are displayed when the user hovers over the chart data.
ChartJS.register(CategoryScale, LinearScale, Title, BarElement, Tooltip);
- Then, create a state object in your React component to store the data for the chart.
const state = {
  labels: [
    'JUNE',
    'JULY',
    'AUGUST',
    'SEPTEMBER',
    'OCTOBER',
    'NOVEMBER',
    'DECEMBER',
  ],
  datasets: [
    {
      backgroundColor: ['red', 'green', 'pink', 'orange', 'yellow', 'lime'],
      hoverBackgroundColor: 'lightblue',
      borderRadius: 8,
      data: [40, 40, 50, 60, 80, 90, 70],
    },
  ],
};

const BarChart = () => {
  return (
    <div>
      <h1 className="font-extrabold">Sales for the month of JUNE-DECEMBER</h1>
      <Bar data={state} />
    </div>
  );
};

export default BarChart;
- Lastly, create a function that returns the JSX of the React component with the data you have made.
const BarChart = () => {
  return (
    <div>
      <h1 className="font-extrabold">Sales for the month of JUNE-DECEMBER</h1>
      <Bar data={state} />
    </div>
  );
}

export default BarChart;
The result

In addition to creating bar charts, the chart.js library also offers the ability to create other types of charts, such as pie charts and line charts.
Creating a Pie chart using chart.js
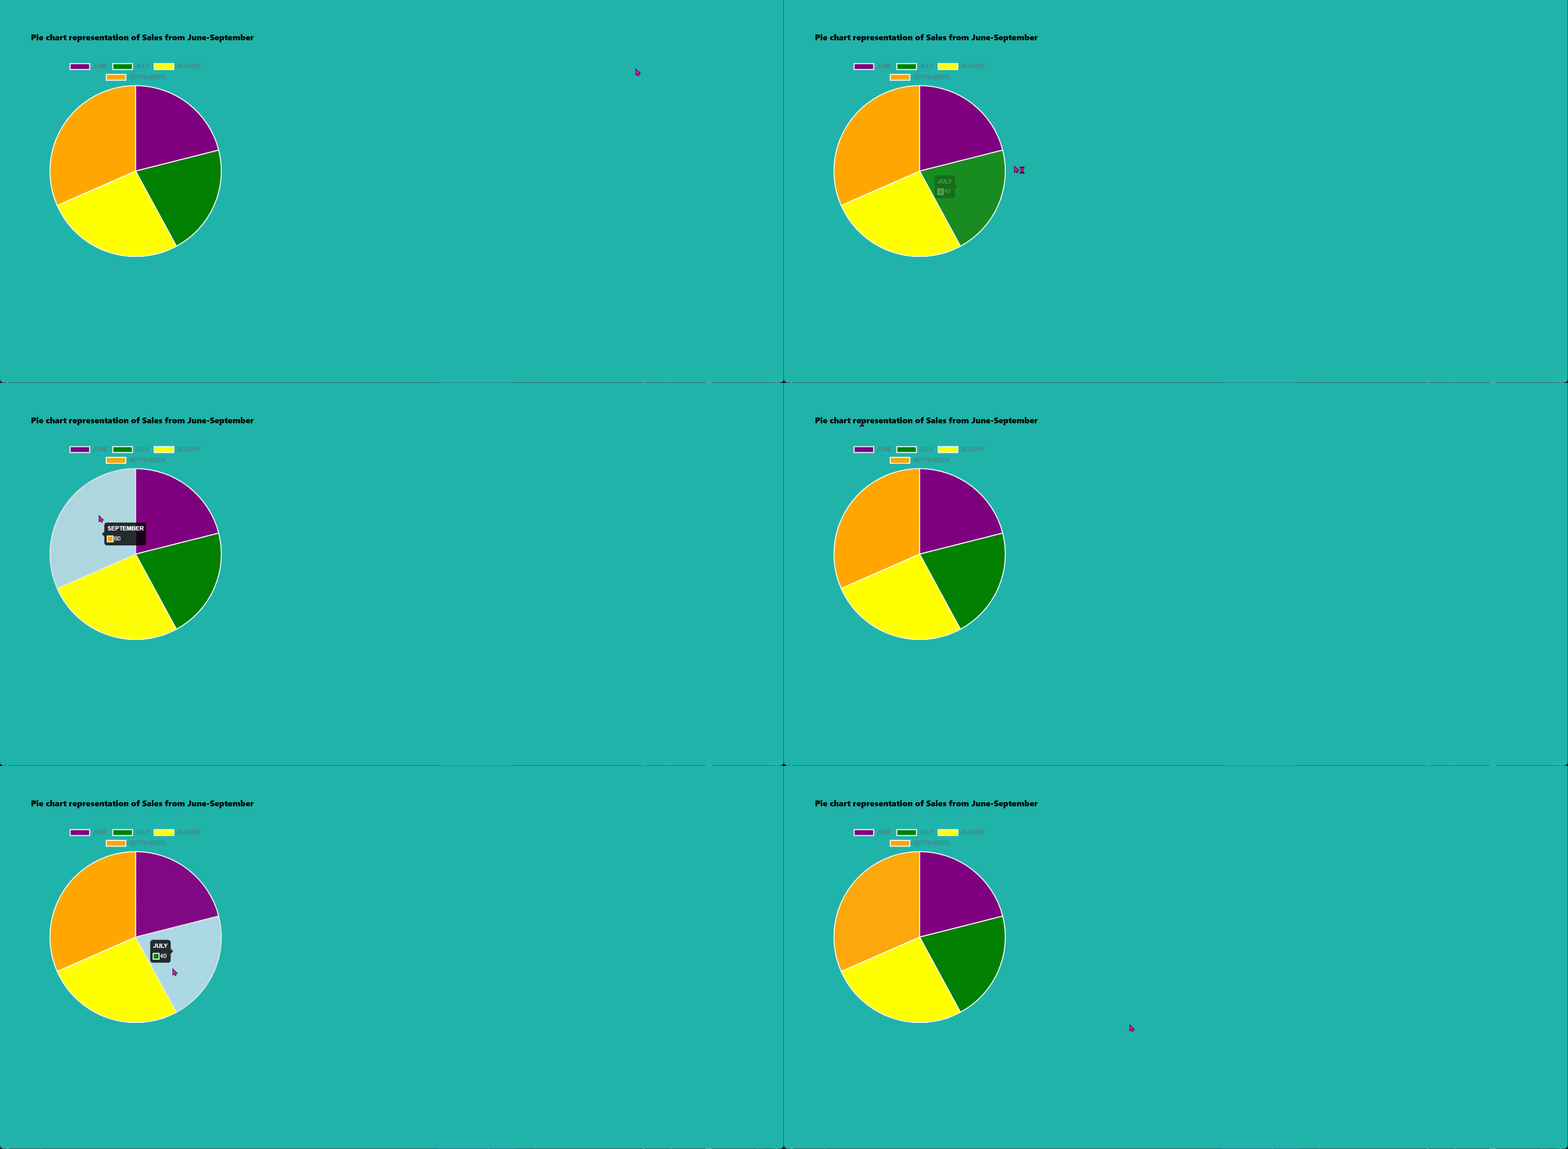
Pie charts are circular diagrams that have been broken into sections, or "slices," that show the distribution of various data values. Each segment represents a certain data category, and its size reflects the magnitude of the corresponding data value.
A pie chart offers a better visual representation of the percentage of various data categories within the entire dataset than a bar chart does.
- Import the
Piefrom thereact-chartjs-2library into your React component.
import { Pie } from 'react-chartjs-2'
- Import the pie chart labels from Chart.js
import { Chart as ChartJS, ArcElement, Tooltip, Legend } from 'chart.js'
- Activate the labels by registering them such as tooltips. This will ensure that the labels are displayed when the user hovers over the chart data.
ChartJS.register(ArcElement, Tooltip, Legend);
- Create a state object in your React component to store the data for the chart.
const state = {
  labels: [
    'JUNE',
    'JULY',
    'AUGUST',
    'SEPTEMBER',
  ],
  datasets: [
    {
      backgroundColor: ['purple', 'green', 'yellow', 'orange'],
      hoverBackgroundColor: 'lightblue',
      data: [40, 40, 50, 60],
    },
  ],
};
- Lastly, create a function that returns the JSX of the React component with the data you have made.
const Piechart = () => {
  return (
    <div>
      <h1 className='font-extrabold'>Pie chart Sales from June-September</h1>
      <div style={{ width: '40%' }}>
        <Pie data={state} />
      </div>
    </div>
  );
}
From the above code, the returned JSX is wrapped in another div; this is just for styling purposes to reduce the width.
The result

Creating a Line chart using chart.js
A line chart is a graph made up of points connected by straight lines. It can be used to visualize changes in data over time and other types of data relationships.
- Import
Linefrom thereact-chartjs-2library into your React component.
import { Line } from 'react-chartjs-2'
- Import Line chart labels from Chart.js
import {
    Chart as ChartJS,
    LineElement,
    CategoryScale, //x-axis
    LinearScale, //y-axis
    PointElement,
    Tooltip,
} from 'chart.js';
- Activate the labels by registering them such as tooltips. This will ensure that the labels are displayed when the user hovers over the chart data.
ChartJS.register(
    LineElement,
    CategoryScale,
    LinearScale,
    PointElement,
    Tooltip
);
- Create a state object in your React component to store the data for the chart.
const state = {
  labels: ['Lagos', 'USA', 'Canada', 'Australia'],
  datasets: [
    {
      backgroundColor: ['blue', 'green', 'yellow', 'red'],
      data: [30, 4, -5, 37],
      borderColor: 'black',
    },
  ],
};
- Lastly, create a function that returns the JSX of the React component with the data you have made.
const Linechart = () => {
  return (
    <div>
      <div>
        <h1 className="font-extrabold">Temperature line chart</h1>
        <div style={{ width: '50%' }}>
          <Line data={state} />
        </div>
      </div>
    </div>
  );
}

export default Linechart;
From the above code, the returned JSX is wrapped in another div; this is just for styling purposes to reduce the width.
The result

Conclusion
A useful tool for building different charts in React applications is Chart.js. Nevertheless, we were only able to discuss the most popular ones in this post.
By offering a set of React components that can be used to assemble charts with just a few lines of code, the react-chartjs-2 package makes it simple to implement Chart.js charts in React apps. This makes the process of producing charts in React applications very straightforward and uncomplicated.
- Check out a project I created using chart.js
Resource
You can find more information about Chart.js by reading through its official documentation. It covers the library's features, usage, and more.
Thanks for reading💖


